
The Climate Urgency Gap
A U.S. state-level analysis of the gap between climate belief, emotional urgency, and support for clean energy action
The 6 percentage point national gap between knowing and feeling is the central finding. It is consistent across almost every state. Belief is not the bottleneck. Emotional connection to the issue is. The data infrastructure that translates physical climate reality into felt urgency is failing at the last mile.
Maine, Utah, Florida, Montana, and Idaho all show gaps above 7.5 percentage points between belief and worry. Florida is already experiencing accelerating sea level rise and intensifying hurricane seasons. The states where the belief-worry gap is largest are not the states least exposed to climate risk. They are often among the most exposed.
Across all 50 states, support for funding renewable energy ranges from 71% to 84%. Even the states with the largest gaps between knowing and feeling show strong majority support for solar, wind, and CO2 regulation. The policy window is open. The urgency to use it is not keeping pace.
Charts & blocks
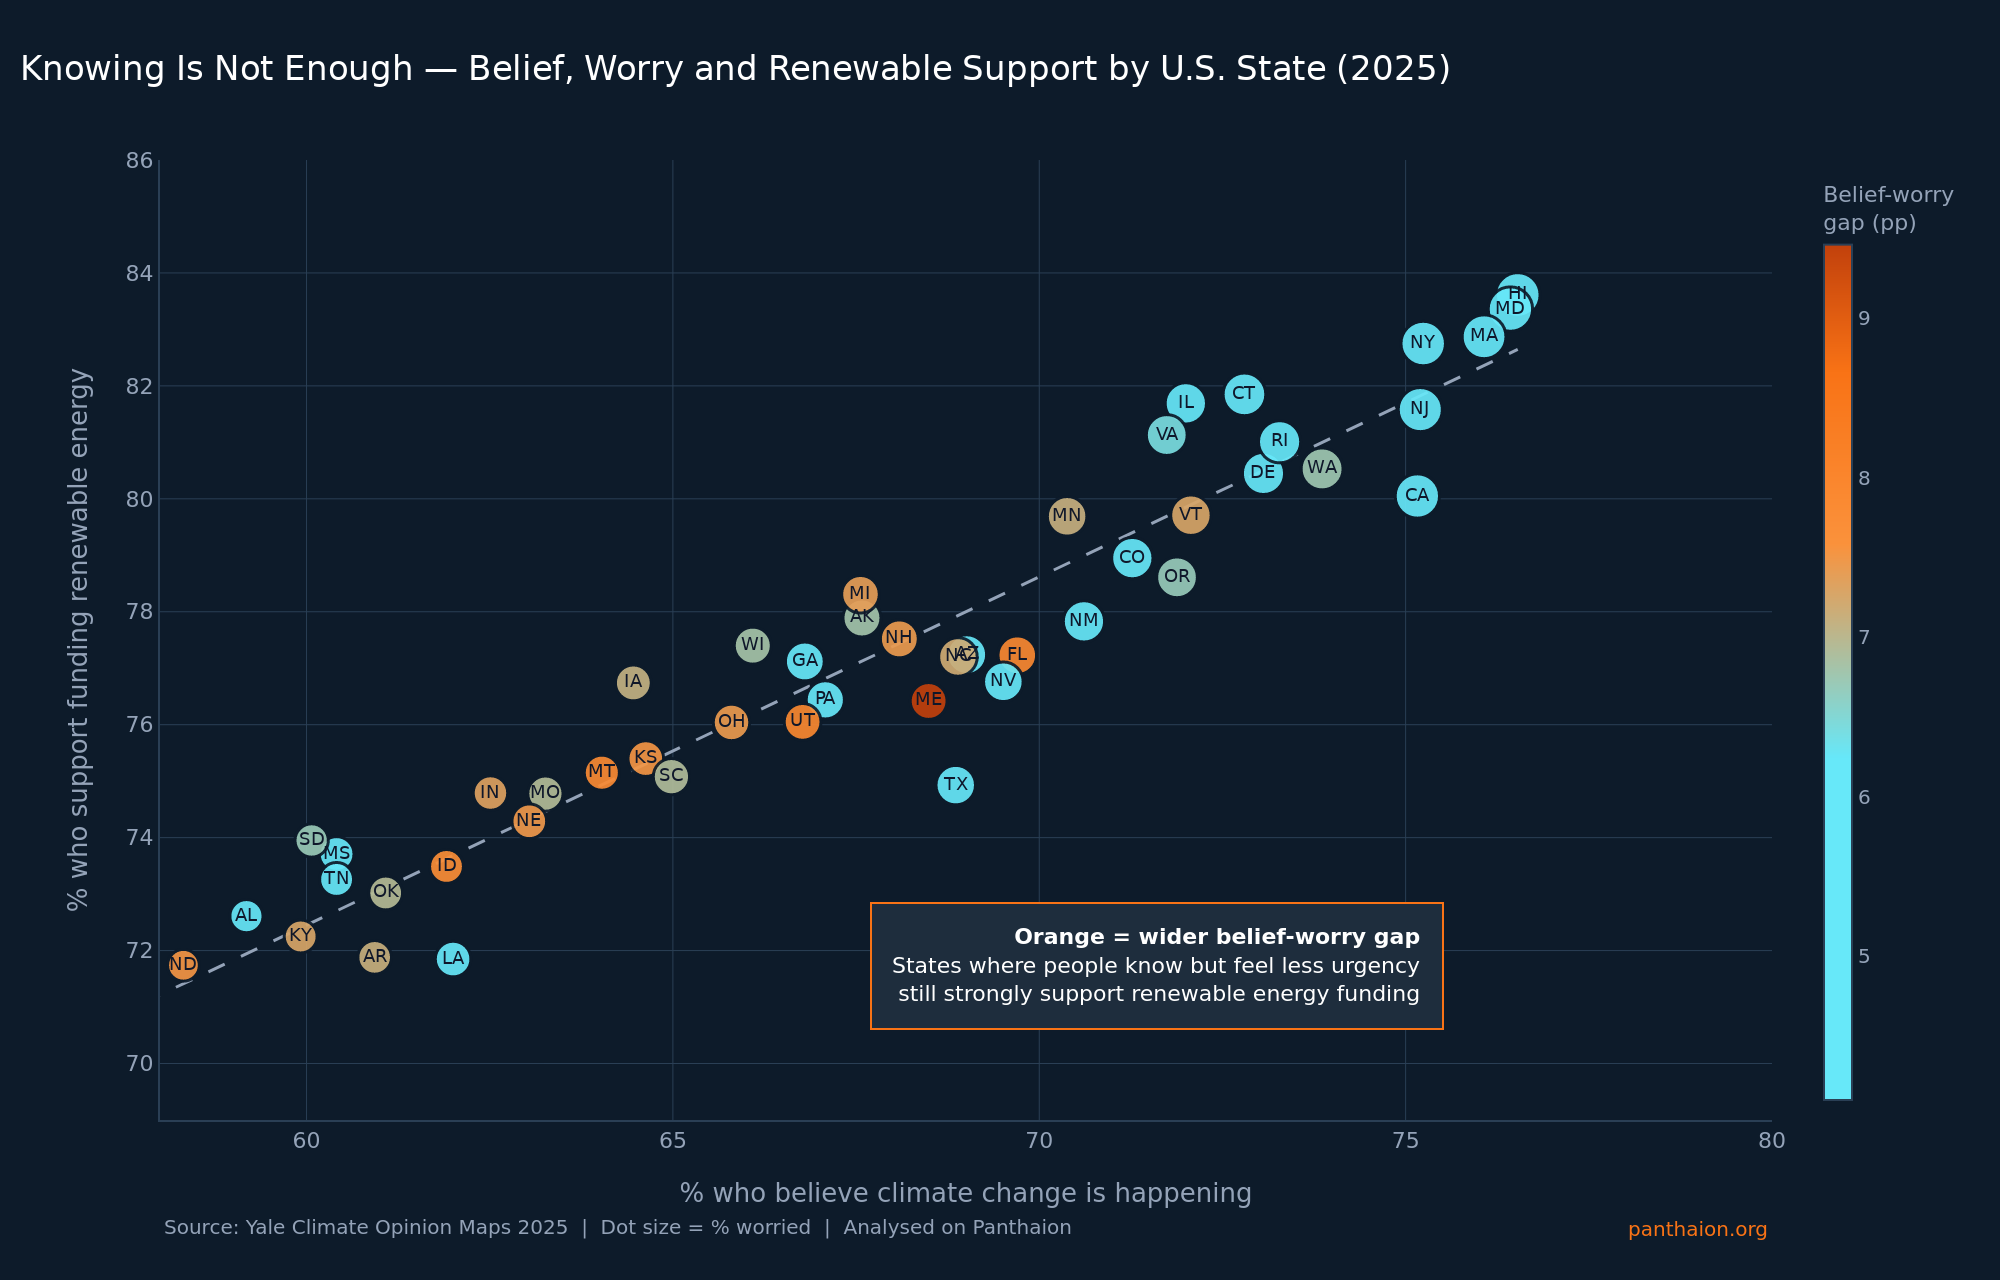
This scatter plot places every U.S. state as a labelled dot. The x-axis shows the percentage of state residents who believe climate change is happening. The y-axis shows the percentage who support government funding of renewable energy research. Each dot is sized by the percentage who are worried about climate change, and coloured by the gap between belief and worry: cyan dots have a small gap, meaning belief and worry are well aligned; orange and deep orange dots have a large gap, meaning many more people believe than feel urgency.
Summary
No short summary yet.
Most Americans know climate change is real. Far fewer feel urgency about it. And yet, despite that gap, support for clean energy policy across every U.S. state remains remarkably high. This analysis uses Yale's 2025 Climate Opinion Maps to ask a question the headline surveys rarely surface: is the perception gap a belief problem, a worry problem, or something else entirely?
The answer matters because the data infrastructure that communicates climate progress to the public is not working. The transition is accelerating. Coal is falling. Renewables crossed the 30% threshold in Europe. Solar is on track to become the world's largest electricity source within six years. And yet pessimism about collective action is rising, not falling, among the demographic groups most likely to support the policies that make those milestones possible.
Methodology
Data source: Yale Program on Climate Change Communication, Climate Opinion Maps 2025 edition, covering all 50 U.S. states plus the District of Columbia. The dataset is based on a multilevel regression and poststratification model applied to national survey data, producing state-level estimates of climate opinion across more than 30 variables. Analysis was conducted on Panthaion using the 2025 cross-section of state-level estimates. The belief-worry gap is calculated as the difference between the percentage of state residents who believe climate change is happening and the percentage who say they are worried about it. Dot size in the scatter plot encodes the percentage who are worried. Colour encodes the belief-worry gap from cyan (small gap) to deep orange (large gap).
Datasets used
Papers
No public papers listed.
Datasets
Notebooks
No notebooks are listed for the public page yet. The project owner can choose notebooks in the Showcase builder.
Provenance
Notebook cell executed.
Notebook cell executed.
Notebook cell executed.
Saved notebook to project: "Analyze with Python — Yale Climate Opinion Maps 2025 - Panthaion".
No extra payload on this event.
Notebook cell executed.
Saved notebook to project: "Analyze with Python — Yale Climate Opinion Maps 2025 - Panthaion".
No extra payload on this event.
Notebook cell executed.
Notebook cell executed.
Notebook cell executed.
Notebook cell executed.
Notebook cell executed.
Notebook cell executed.
Notebook cell executed.
Notebook cell executed.
Notebook cell executed.
Notebook cell executed.
Created notebook "When the Data Does Not Reach the People".
No extra payload on this event.
Dataset "Yale Climate Opinion Maps 2025" (vv1) linked.
No extra payload on this event.
Empty project created.
No extra payload on this event.
Discussion
Threads workspace members link to this project appear here. Open Forums for the full forum.
No linked threads yet.